
Semiconductor Industry News: Key Technical Developments
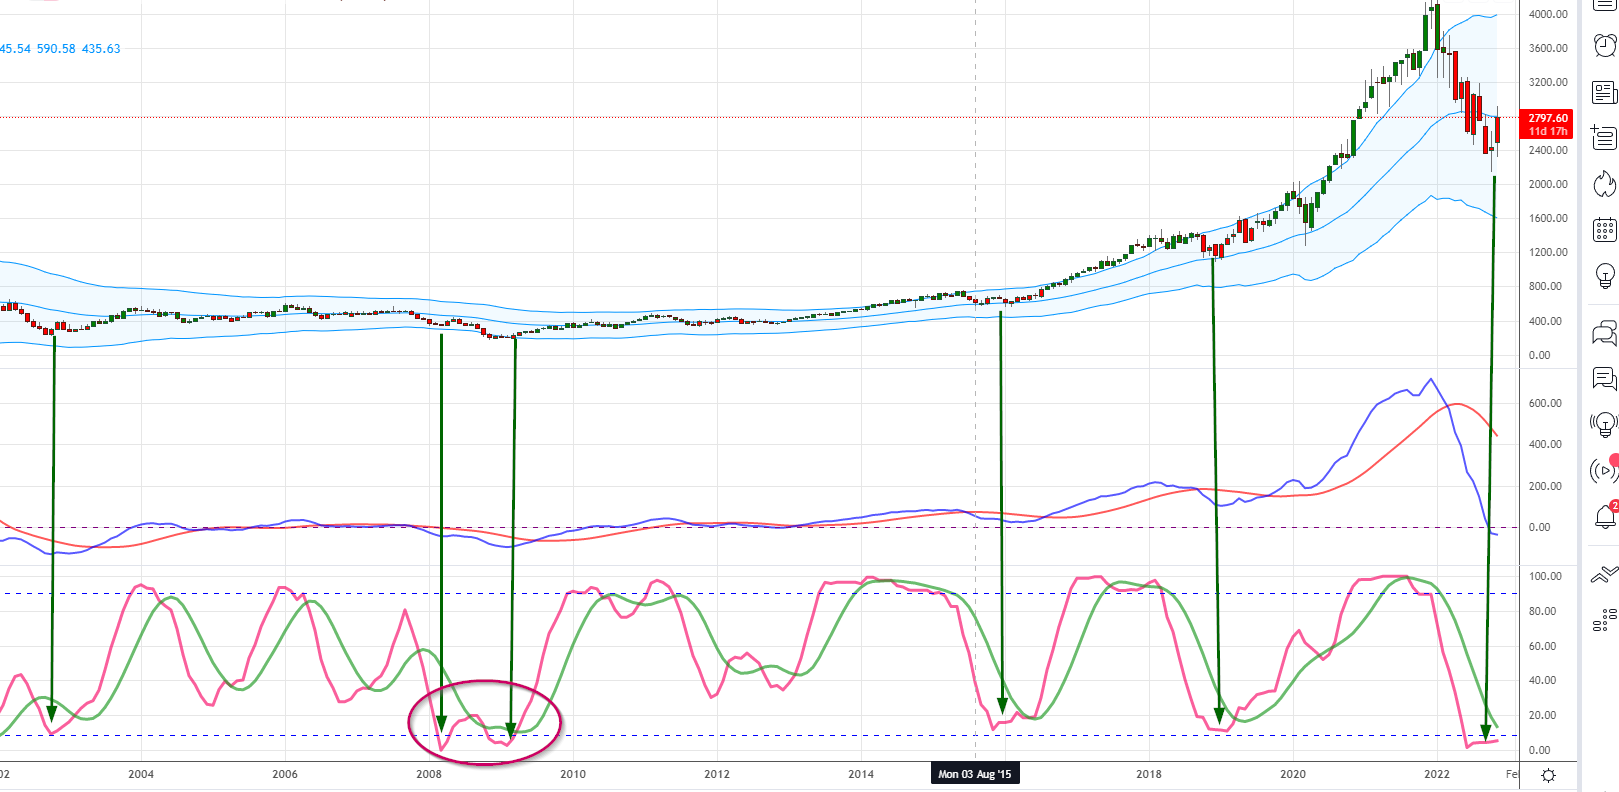 In each case, from an extended point of view, when the SOX found itself trading within these boundaries, it proved to be a brilliant long-term investment. A proper turnaround is near when our secondary indicator (MACD 2) drops below three on the lower panel. In at least one event (as shown by this very chart), the mentioned indicator hit rock bottom and failed to complete its entire cycle. However, this unexpectedly turned into an even greater opportunity.
Whenever a time-tested indicator struggles to complete its full cycle (meaning from the lows of oversold to the highs of overbought, and vice versa), the following move in the same direction tends to be twice as strong. Currently, our primary measure (MACD1) has fallen from an extremely overbought state to an almost ridiculously oversold condition. The most severe reading was -4.93 in October 2002, and our current figure is a negative 3.5. We speculate that it may well reach -6, and should this prediction come true, it would create a “screaming buy” opportunity.
Bullish Perspectives and SOX Predictions
The highly overbought reading (around January 2022) is totally bullish from a long-term viewpoint, as it suggests that MACD1 values will likely climb to new heights, in turn leading to new peaks for the SOX. We reckon that the SOX will triple before the next bull’s final act.
Without semiconductors, artificial intelligence is nothing but a pipe dream. Every sector connected to this market is destined to trend higher – the designers, manufacturers, and suppliers of the raw materials necessary to fuel this growing sector, and so on. For example, without Neon Gas, this very sector would be rendered useless.
Semiconductor Industry News: The Real news is the Supertrend
Significant wealth is gained by sticking to the super-trend, rather than constantly checking one’s portfolio. The upward phase of a super-trend cycle lasts much longer than its downward counterpart. A whopping 90% focus on the latter phase. We made a tidy sum from the companies in which we invested before the recent market correction – and these were not just paper profits, but gains we actually banked. The markets are currently going through a cleansing phase. Once this comes to an end, the era of massive profits shall start all over again.
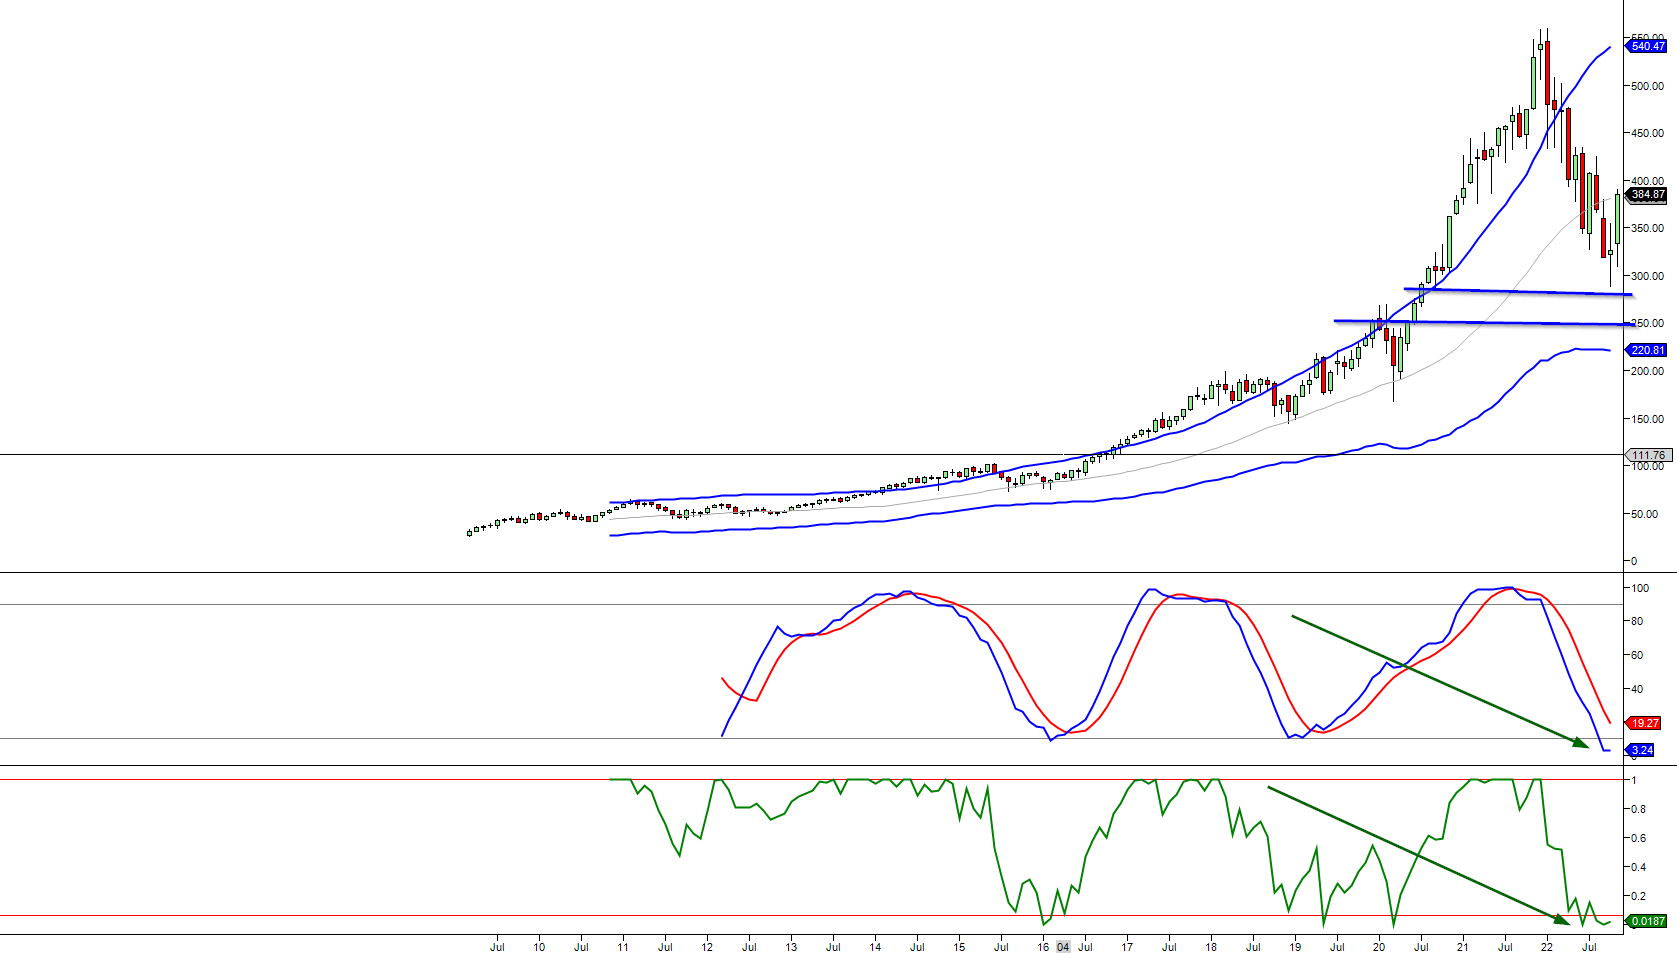
Monthly Chart of the SOX via ETF SOXX
Adjusting the MACDs: A Method to the Madness
The settings on the MACDs here (first indicator) differ from those employed on the initial chart. One might ponder the rationale behind employing disparate values. While we have broached this subject numerous times over the years, allow us to provide a hint: there is, indeed, more than one way to skin a cat. In this particular chart, the MACDs are trading at a fresh nadir. Although this ETF is not as venerable as the SOX index, it aptly illustrates the incredible opportunity this sector shall furnish for the astute.
RSI and Support Zones: Identifying Opportunities
The RSI is also trading in the highly oversold realms. A robust zone of support exists in the 280 to 291 range, with solid support found within the 255 to 267 range. A test of these levels, or lower, would constitute a screaming buy. Should a fortuitous event transpire, with the ETF plummeting to the 222 to 237 range, it would be akin to a “back up the truck” moment.
A Brewing Opportunity in Semiconductors and A.I.
In summary, a colossal opportunity is fermenting in the Semiconductor and A.I. sector, potentially overshadowing any other semiconductor industry news. While news may tantalise the ears, it is the mastery of playing the trend that can truly enrich one’s bank account. Remain vigilant and astute, dear investor, for these burgeoning markets could provide unparalleled rewards for those who seize the opportunities that lie ahead.