

The psychology of contrarian investors; Gauge the sentiment before acting
The first thing is to make sure you understand the difference between contrarian investing and Fashion Contrarian investing. These contrarian investment guidelines by no means encompass everything one needs to know about trading, but it can seriously help you become a better trader/investor.
Rule 1
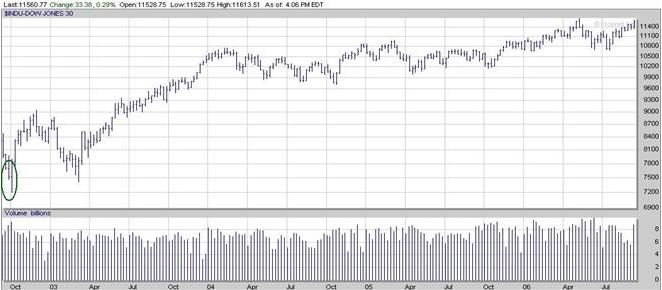
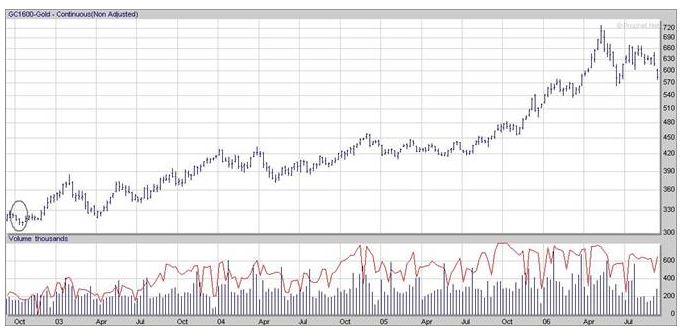
All popular magazines, news articles and TV stations should be used only for obtaining information that you don’t plan on using; you use this information to find out what the masses are doing. For example, if they tell you its time to buy gold, its time to get ready to sell if they tell you the market looks like its going to crash, we are probably close to a bottom etc
Rule 2
Spend time learning Technical Analysis; this is very important. We have just updated the investor tools section on our web page. There are many educational resources there now, so use them it cost you nothing and took us time to put them up. Free Trading Resources
Rule 3
Have a plan. only fools buy or sell stocks without a plan. The plan should include profit targets on each and every trade, plus and this very important, an exit plan, in case the trade does not work out.
Rule No 4
Do not deal with options: it should be part of your investment plan but not your only plan. You are far better of playing futures if you are going to waste all your money on options only, futures are much cleaner, less slippage, less spread and you can get a feel for it because you can study the pattern of one market. I am not saying that everyone should get up and play futures, but if you are going to be a fool and play only options, then the wiser thing to do would be to learn futures and attempt to get in tune with one of the markets ie Dow futures. In addition, remember the saying “A fool and his money are soon parted”; having said that options are absolutely fabulous instruments to lock in spectacular profits.
Contrarian Investing No 5
 With proper money management, one could lose his entire options portfolio and still walk away with a profit.
We will use a 100K portfolio for this example
10% is 10K
Okay, you lose the entire 10K by playing options idiotically.
Now you play nice and safely with the other 90K and you make 30% for the year. Don’t say it’s not possible; all of you who have long-term positions in Gold is up more than 30% this year alone. Just catch the major trend and follow it. So you make 27K so you know have a total of 117K, but let’s say you make only 20% that brings the total to 108K, you could even make 15% and still walk away with a profit.
The key here is that you live to fight again and then you can take some of these profits and play options once more
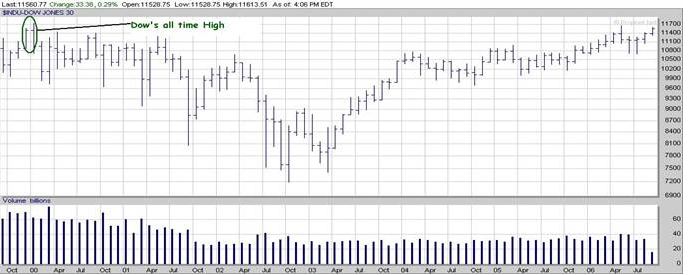
The most important factor to remember is that all stock market crashes or strong corrections should be viewed through a bullish lens from a long-term perspective.
The stock market is not static its dynamic
In addition to the above essential rules of contrarian investing, investors would do well to read the following new notes. Investing is not a static field; it’s a dynamic field, and you have to in it to win it. In other words, just sitting on the sidelines hoping to gather all the information via theoretical models will only work well in an intellectual environment. Real life and actual market action is an entirely different beast. Start small, learn from your mistakes, keep notes and when you start to trade successfully slowly increase the dollar amount of your investments.
An accurate measure is that you buy because the price is at mouth-watering levels, it’s in a strong sector, and you checked the charts. Your purchase passes the necessary technical analysis tests.
One key point to remember is that even though everything looks good, you should still be nervous or scared. You should be saying something like this, “Hey, am I the only one buying. I don’t want to go against the crowd. A true Contrarian always feels this fear, and you have to fight it, and say, “Now is the time to buy.”
Over Confidence is dangerous
When you are overly confident, it’s time to flee. Even the best can be taken out. Keep your mental stops tight in this volatile market. Let me expand on the subject:
When you take a position and people look at you with disdain or shock, you know you are doing the right thing!. When they pat you on the back or the rear, it’s time to flee for the exits Gold and silver and commodities are still hated with a passion. Therefore, one has to understand that the massive hate for this sector makes it the best contrarian play ever. Get it? Buy low. Sell high.
Finally, we hope that these contrarian investment guidelines prove to be useful to you now and in the years to come.


 Analysis. We have dedicated a huge amount of time to put out the Psychology for Dummies section, and we hope it helps shed some light on this topic. Understanding how the markets operate is not something that can be mastered in 1-3 day.