Stock Market Crash: Imminent or does this Stock Market Bull still have legs?

imminent stock market crash

Stock market crash imminent; someday but not today

For a long time, we have been stating sharp pull-backs should be viewed through a bullish lens. In this article published in Nov 2017, we stated the following;

View strong corrections through a bullish lens. This game plan will remain valid until the masses turn bullish or the trend turns negative.  The stronger the deviation, the better the opportunity. Tactical Investor   

In the above article, we also noted that the trend had to remain positive and sentiment should not turn bullish. Things worked out well up until Jan of 2018.   In January bullish sentiment suddenly soared to a six-year new high and at that point, we knew all was not well.  For until that moment the market was soaring to new highs on negative sentiment, illustrating the principle of “a market climbs a wall of worry” to its fullest, but that all changed in January.

Fear is a great long-term bullish force for the markets

Interestingly, the Dow missed the low-end targets we issued in Nov by 1400 points, so does that mean the upward journey is over.  Before we answer that, understand that nothing trends up in a straight line; a healthy market always lets out doses of steam on its upward journey; sometimes the pullbacks are minor, and sometimes they are very strong. At the time we noted that the markets were extremely overbought and even went on to issue possible downside targets if the markets decided to let out some steam.

 While the Dow is trading in the extremely overbought ranges, any pullback will most likely end in the 21,000-21,500 ranges.  For the correction to pick up steam, it would need to close below this level on a weekly basis.  As the trend is still positive, the odds of the Dow crashing are very low. At the most, the Dow would test its breakout point which falls in the 18,900-19,200 ranges unless the trend were to turn negative suddenly or the masses suddenly embraced the market with gusto.  At this point, the trend is strong and showing no signs of weakening.  Remember that the markets can remain irrational for much longer than most traders can remain solvent by betting against it. Tactical Investor   

The Stock Market had to let out steam but

Instead of letting out steam, the markets overheated and continued to surge to new highs almost on a weekly basis until Jan of 2018. At that point, as we stated above bullish sentiment soared; the masses embraced the markets with gusto; in fact in Jan Bearish sentiment dropped to a multiyear low of 15% and bullish sentiment soared to 60%.

So back to the question we asked before.  Does this mean the end is near?  That’s the billion dollar question and articles such as these whose sole function seems to be sensationalistic rather than realistic don’t help improve the outlook for the average Joe. Both articles were published on CNBC.

Stock market looks ‘pretty fantastic’ despite rising yields: Art Hogan

‘Epic’ market bubble is ready to burst, and stocks could plunge, strategist warns

A stock market crash is not likely at this moment, because the market has pulled back sharply several times since January and the masses are nowhere as bullish as they were in Jan of 2018.  Given the massive run, this bull has experienced the current action though painful from an emotional perspective is well within the norm. No market can trend in a straight upward line forever; the equation must balance.  We expect volatility to remain an issue until bearish sentiment surges past the 50% mark; a move to the 60% ranges would be ideal

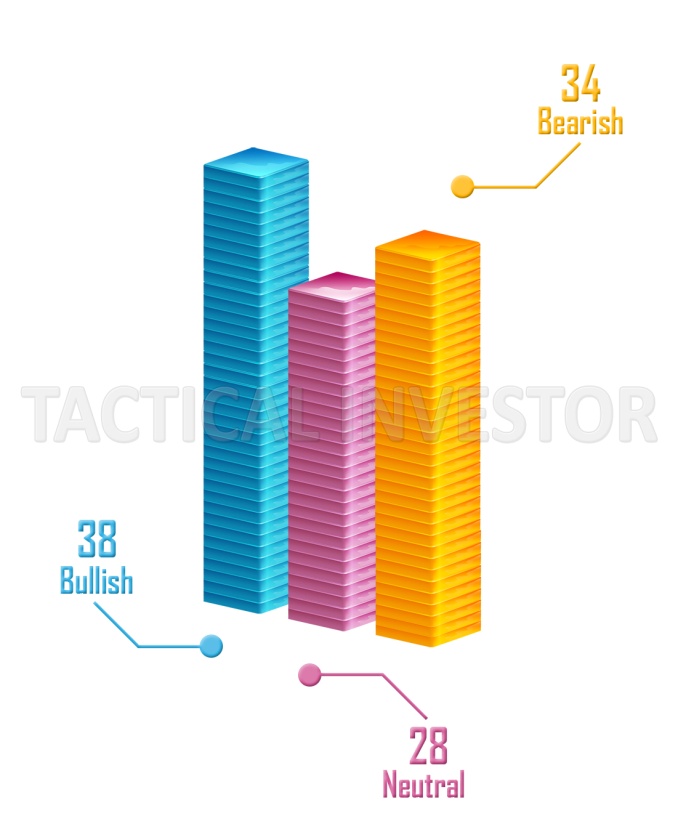
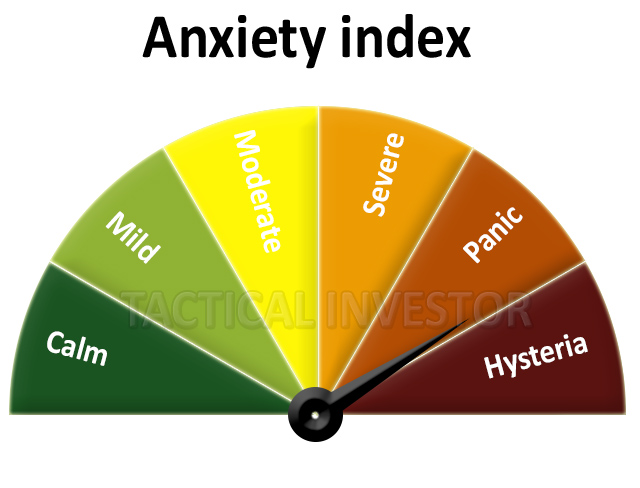
The crowd is becoming anxious as evidenced by the data below:

anxiety-index-25-april-2018

bullish-neutrl-bearish-sentiment-april-2018.jpg

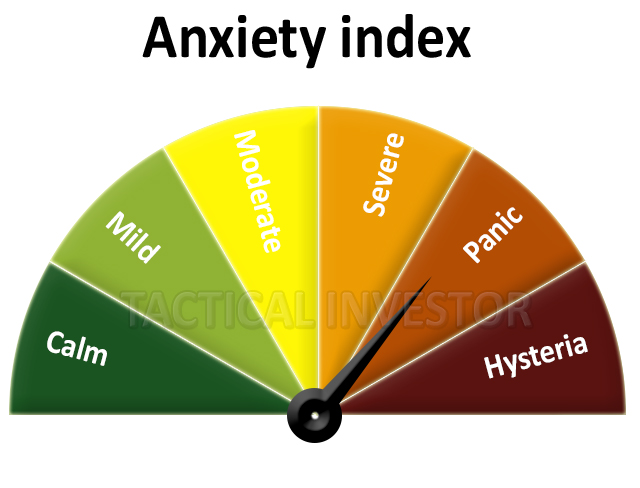
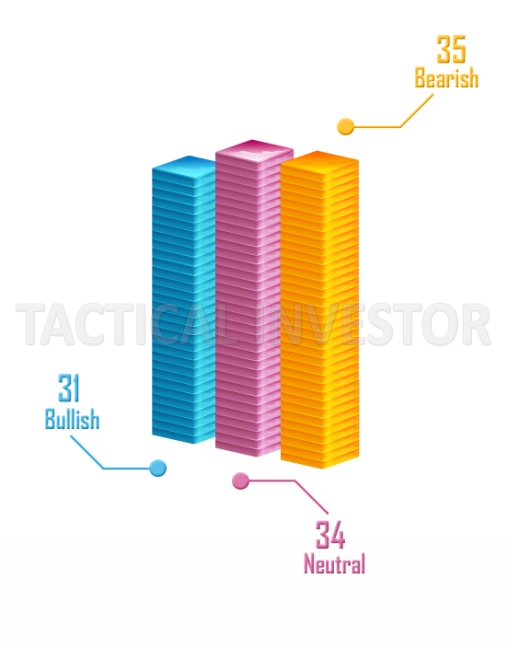
While the bearish sentiment still has some way to go to before it hits the 50% mark; bullish sentiment has pulled back strongly, and the number of neutrals has surged. Neutrals are bears with no teeth and bulls with no ba**s. Contrast the above reading to those of January 2018.

bullish-neutrl-bearish-sentiment-january-2018.jpg

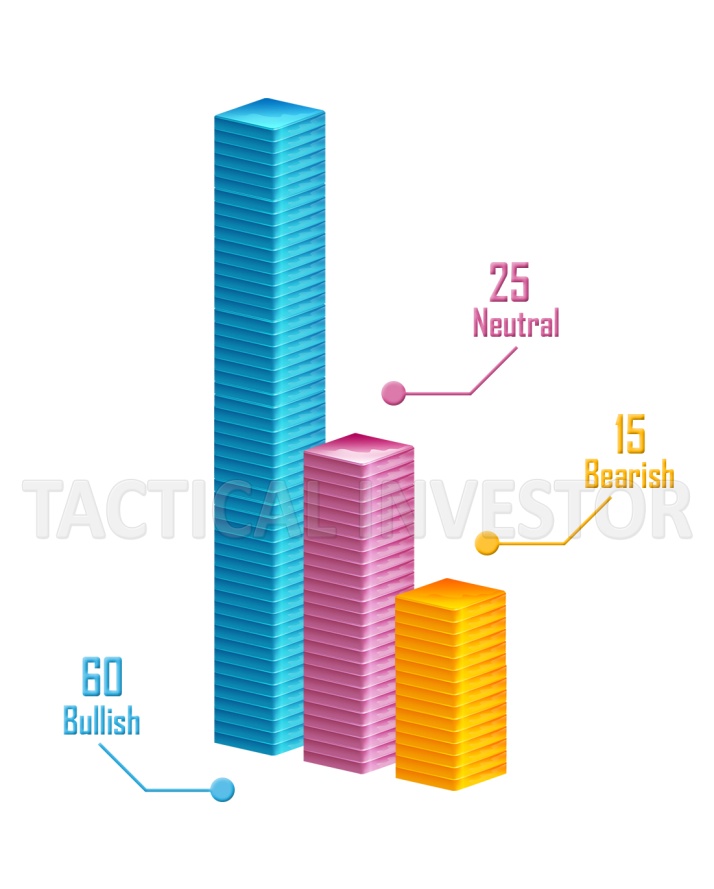
Bearish sentiment was at a multiyear low back in Jan of this year; in fact, based on those sentiment readings the current pullback is minor. It is easy to get drawn into the “hysteria” and forget just how far this market has risen; the market is taking a well-deserved breather.

Conclusion

As this pullback was long in the making, the action is going to remain volatile until the bearish sentiment soars well past the 50% mark. From a psychological point, the only way to completely destroy this surge in bullish sentiment and to ensure it rises slowly would be to decimate the morale of the masses, and that’s what’s taking place now.

While a crash spooks the masses for a while, nothing destroys investor morale more than uncertainty. When a market looks like its crashing; they are sure that the sell-off will continue.  Regardless of whether they are right or wrong, the perception of being right is there, and that’s very important.  The masses want to know what to expect and when they don’t, uncertainty sets in. Uncertainty is fantastic when it comes to the markets for the masses keep jumping from one camp to another; each jump demoralises them more and more.  This demoralising effect is very powerful for it provides the investor that has no emotional stake with an unbelievable long-term opportunity. The other way to demoralise the crowd (and this does not occur often) is for the markets to pullback extremely strongly; for example, losses of 30% or more over a very short period.  Market Update April 17, 2018

conclusion-chart.png

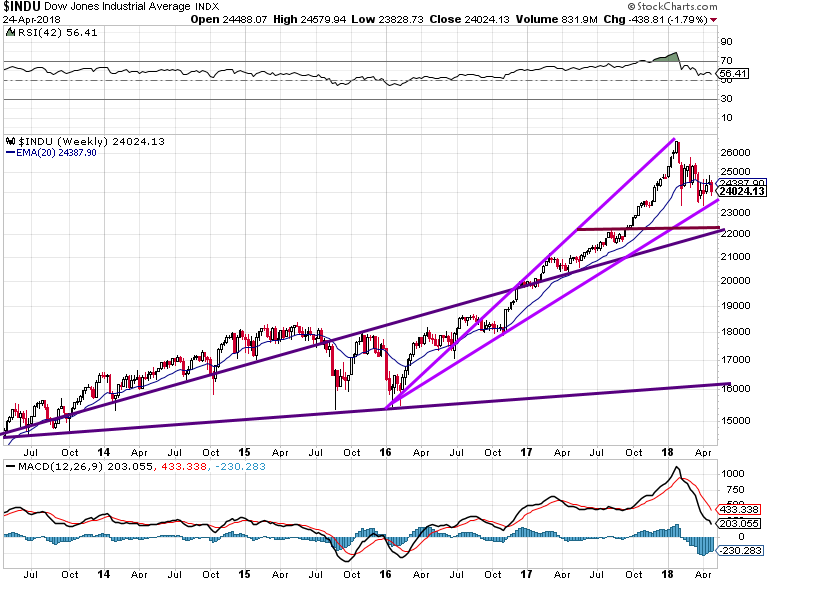
This correction is likely to end in 23,400-23,800 ranges, with a possible overshoot to the 22,500 ranges.  The Dow would need to close below 22,000 on a monthly basis to indicate that the outlook is set to worsen.

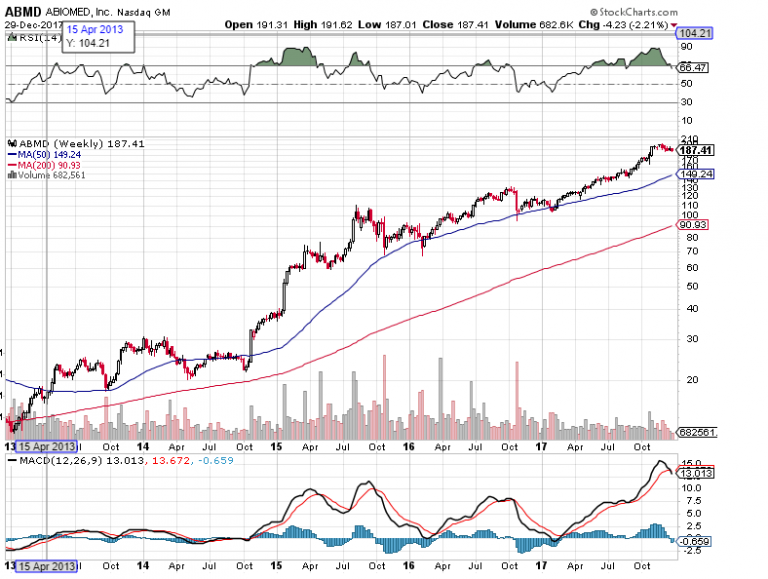
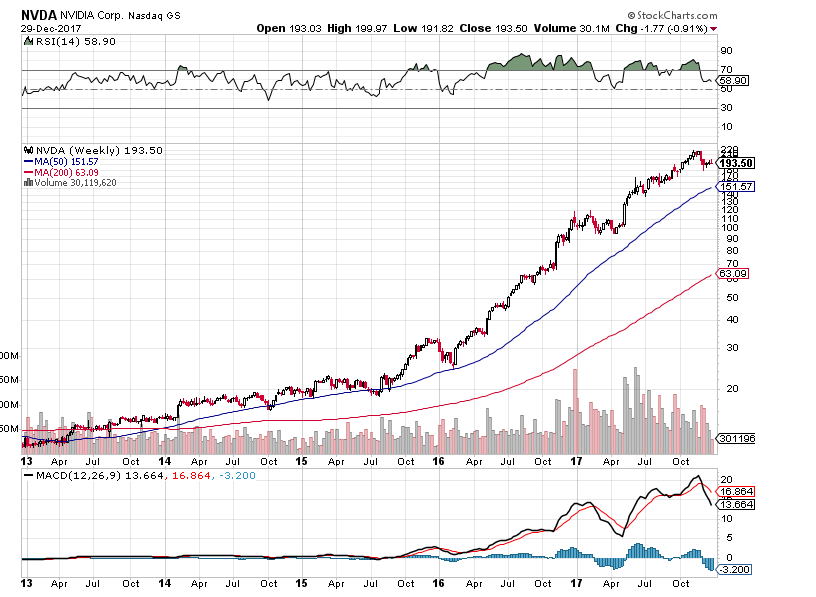
The Dow is likely to trade over a wide range, and the moves are expected to be very volatile; be ready to deal with intraday moves of as much as 1200 points in a day. The markets need to move to the extremely oversold ranges, and if you look at the MACD’s on the above chart, you can see that they still have room to trade before getting into that zone.  The rapid up-down action is the best way outcome because it achieves two objectives; it demoralises the masses and helps push the markets into an oversold state.  Until the trend turns negative, strong pullbacks should be viewed through a bullish lens.  We would build a list of stocks we would love to own and use pullbacks to build positions in them. Stocks like TCEHY, NLFX, ROST, HA, CHKP, etc look interesting.


Crazy Stock Market: Trend is Gathering Momentum

Stock market Insanity Trend is Gathering Momentum

Stock Market: Craziness in action

The charts below clearly reveal that the markets are not operating as they did in the past.

For example, many stocks are trending upwards while key technical indicators move from the overbought to the oversold ranges. If this took place on the daily charts it could be ignored, but, these developments are taking place in the slow-moving monthly charts, and it suggests that a new trend might be about to take hold. Then you have stocks that trend endlessly in the overbought ranges with no sign of letting up, but the stock continues to trend higher and higher. If this trend takes hold, then a plethora of technical analysts will face the ultimate challenge: “Adapt or die”.

ABMD

Stock market Insanity chart

This is a stock we booked profits of 30% not too long ago, continues to illustrate why this market is insane.  Instead of pulling back, now that the MACD’s have experienced a  bearish crossover (in the extremely overbought ranges), the stock is holding up very well.  The last bearish MACD crossover had almost no effect. If the stock does not shed at least 20% from its highs (25% would be preferable), then expect this stock to be trading north of 200 in less than 12 months. Furthermore, it will provide us with an insight of what to expect from the broader markets.

NVDA

NVDA trend chart

Tactical Investor Take

V- readings have soared to unimaginable levels, and the masses are being manipulated very effectively via emotional propaganda. We expect the markets to continue behaving in a manner that defies logic. We also expect extreme altercations between groups with opposing views in the US.  Liberally backed groups such as Antifa have also turned violent, and their violence has shocked many liberals.  You, on the other hand, should not be surprised by such developments as we predicted this.   Insane markets, polarised masses and wild weather will continue to be an issue for months to come.


Article courtesy of Tactical Investor

Stock Market predictions are based on fiction not fact

Market predictions factor

Take for example predictions of the market surging to new highs or the market crashing; the fact is that the same experts play both sides of the game and usually they are late to the party.   Let’s take this a step further; for argument sake let’s assume that the markets are guaranteed to crash in 2018. The same experts made the same claims in 2013, 2014, 2015, 2016 and 2017. Had you listened to them just once and followed their advice over the past five years you would have a lost a small fortune.  How are these guys still standing? They don’t follow their advice, they make money by selling this faulty information to you.

What if there was a better way to look at the situation. The experts are like illusionists; they twist the data and paint a false picture. In essence they are recreating reality.  Based on an examination of historical records, these experts have a dismal record; they make a monkey with darts look like Einstein by comparison.

Take a look at the chart below; it immediately becomes clear that the experts are misleading the masses and that every stock market crash turned out to be a “once in a lifetime buying opportunity”.

Stock Market Crashes Chart from '88 to '18

Regardless of how sharply the markets pulled back they always recouped those losses and then went to rally to new highs.  “Black Monday” one of the most remembered crashes of all times looks like a tiny blip on the chart, yet experts use it all the time to scare the masses of upcoming crashes.   Take a close look, every so-called end of the word crash including the devastating dot.com crash proved to be a buying opportunity. However, you should know when to buy and when to sell and we will address that shortly.

buying is better than running with the herd


Putting the founding principles of Mass Psychology into play would have yielded spectacular results over the years.  The principle is very simple and effective; buy when the crowd is stampeding, and sell when the crowd is euphoric.

Our system has psychological components built into it eliminating the “noise factor” and it focuses on the underlying trend.   It removes any second guessing and pinpoints when you should buy or sell.  We will address this system shortly, but first, we would like to illustrate our system in action.  To show that we are impartial we are not going to provide links only to the site, but to a host of highly rated financial sites that published our articles

Already convinced? -Then you can go straight to the signup page.  If you need more information please continue reading

Jan 24, 2018; our  downside targets for bitcoin

When all the experts were proclaiming that Bitcoin was destined to soar to the moon, we begged to differ and instead we issued downside targets most of which were hit.

On the conservative side, we think Bitcoin could drop down to the 8,800-9,200 ranges, but this market is far from your typical market, and there is a good chance that Bitcoin could drop down to the $5000-$5600 ranges before the dust settles.

For those who want to play the bitcoin market, a somewhat safer alternative would be via Bitcoin Investment Trust (GBTC). Its quite liquid and you can jump in and out with the click of a mouse.   Consider waiting until the sentiment turns decidedly negative or bitcoin is trading at least in the $8000 ranges before deploying some of your funds Market Oracle


Dec 4, 2017; our warning that the Bitcoin Mania was out of hand and that a correction was close at hand

 Bitcoin, on the other hand, is now in the feeding frenzy stage, so this market is ripe for a correction. GoldSeek

Nov 10, 2016, when the markets were getting jittery about a Trump Win

Regardless of what you think of Trump, he is having the same effect as Brexit had on the markets but in smaller doses. If he should win the election, then the reaction will be several magnitudes larger. When the poll results came in stating that Hillary fared better in the 1st debates the markets responded positively and recouped their losses; this reinforces our argument of several years that says substantial pullbacks should be viewed as buying opportunities.

From a contrarian angle (and not a political point of view) a Trump win could be construed as a positive development; non-contrarians will demand to know why? Mass Psychology clearly states that the masses are always on the wrong side of the equation. A Trump win will create uncertainty, and the lemmings will flee for the exits; markets will pull back sharply and viola the same old cycle will come into play. The cycle of selling based on fear which equates to opportunity for those who refuse to allow their emotions to do the talking. Safe Haven


Oct 2015 when the markets were crashing

 Mass psychology clearly states that markets usually run into a brick wall when the Crowd is Euphoric and chanting “Kumbaya my love”. This is not the case yet and sentiment is far from the euphoric zone.  This is one of the most hated bull markets in history. Market Oracle

We went one step further and issued these targets

We have a fair amount of resistance in the 17300-17400 ranges.  The ideal set up would be for the Dow would trade in these ranges, with a possible overshoot to 17,600 and then proceed to test 16,500-16,600 ranges Market Oracle  

Feb 8, 2010; we stated the markets were very overbought and needed to let out at least 1500 points.

To let out enough steam and move the risk to reward ratio in our favour, the Dow would have to at the minimum shed 1500-1800 points, and so far it barely shed 700 points. Tactical Investor.

In April the Dow traded to 9150, and by June it had already shed more than 1500 points. As the trend was positive, there was no need to panic as these proved to be buying opportunities.

In Sept 2009, we stated it was a good time to invest in Gold, Silver and palladium.  We also advocated buying strong non-commodities based stocks.

Use Strong pullbacks in the Gold, Silver and Palladium markets to add to your bullion positions. Individuals willing to take on a bit more risk can purchase a basket of stocks connected to the commodity’s sectorLastly, (besides investing in the commodity sector), buying strong stocks is a better play than investing in housing.  We would focus on strong companies that have robust sales and that are trading in the overbought ranges. For example NTES, NFLX, ABMD, and BREW.   Read full article

July 2008;  a buying opportunity could be close at hand

The good news is that despite this massive sell off our smart money indicator has not reacted negatively and is trading well above its Jan 08 lows; it is also very close to actually issuing a full-fledged buy signal. Tactical Investor 

In every example we cited above, and we could cite dozens more, experts such as Marc Faber, Peter Schiff, and a host of other popular guests on CNBC continuously stated that the markets would meltdown, but in each instance, we took an opposing stance.  The only exception to the market meltdown story was Bitcoin; here the experts were sure that the market would soar to the moon and perhaps to the next galaxy,  as wild insane of targets of $1 million were issued.  James Altucher and John Macafee both stated that  bitcoin could soar to a million dollars.

Ready to sign up? or Continue reading?

Why would the experts purposely misdirect the masses?

Experts purposely misdirect the masses
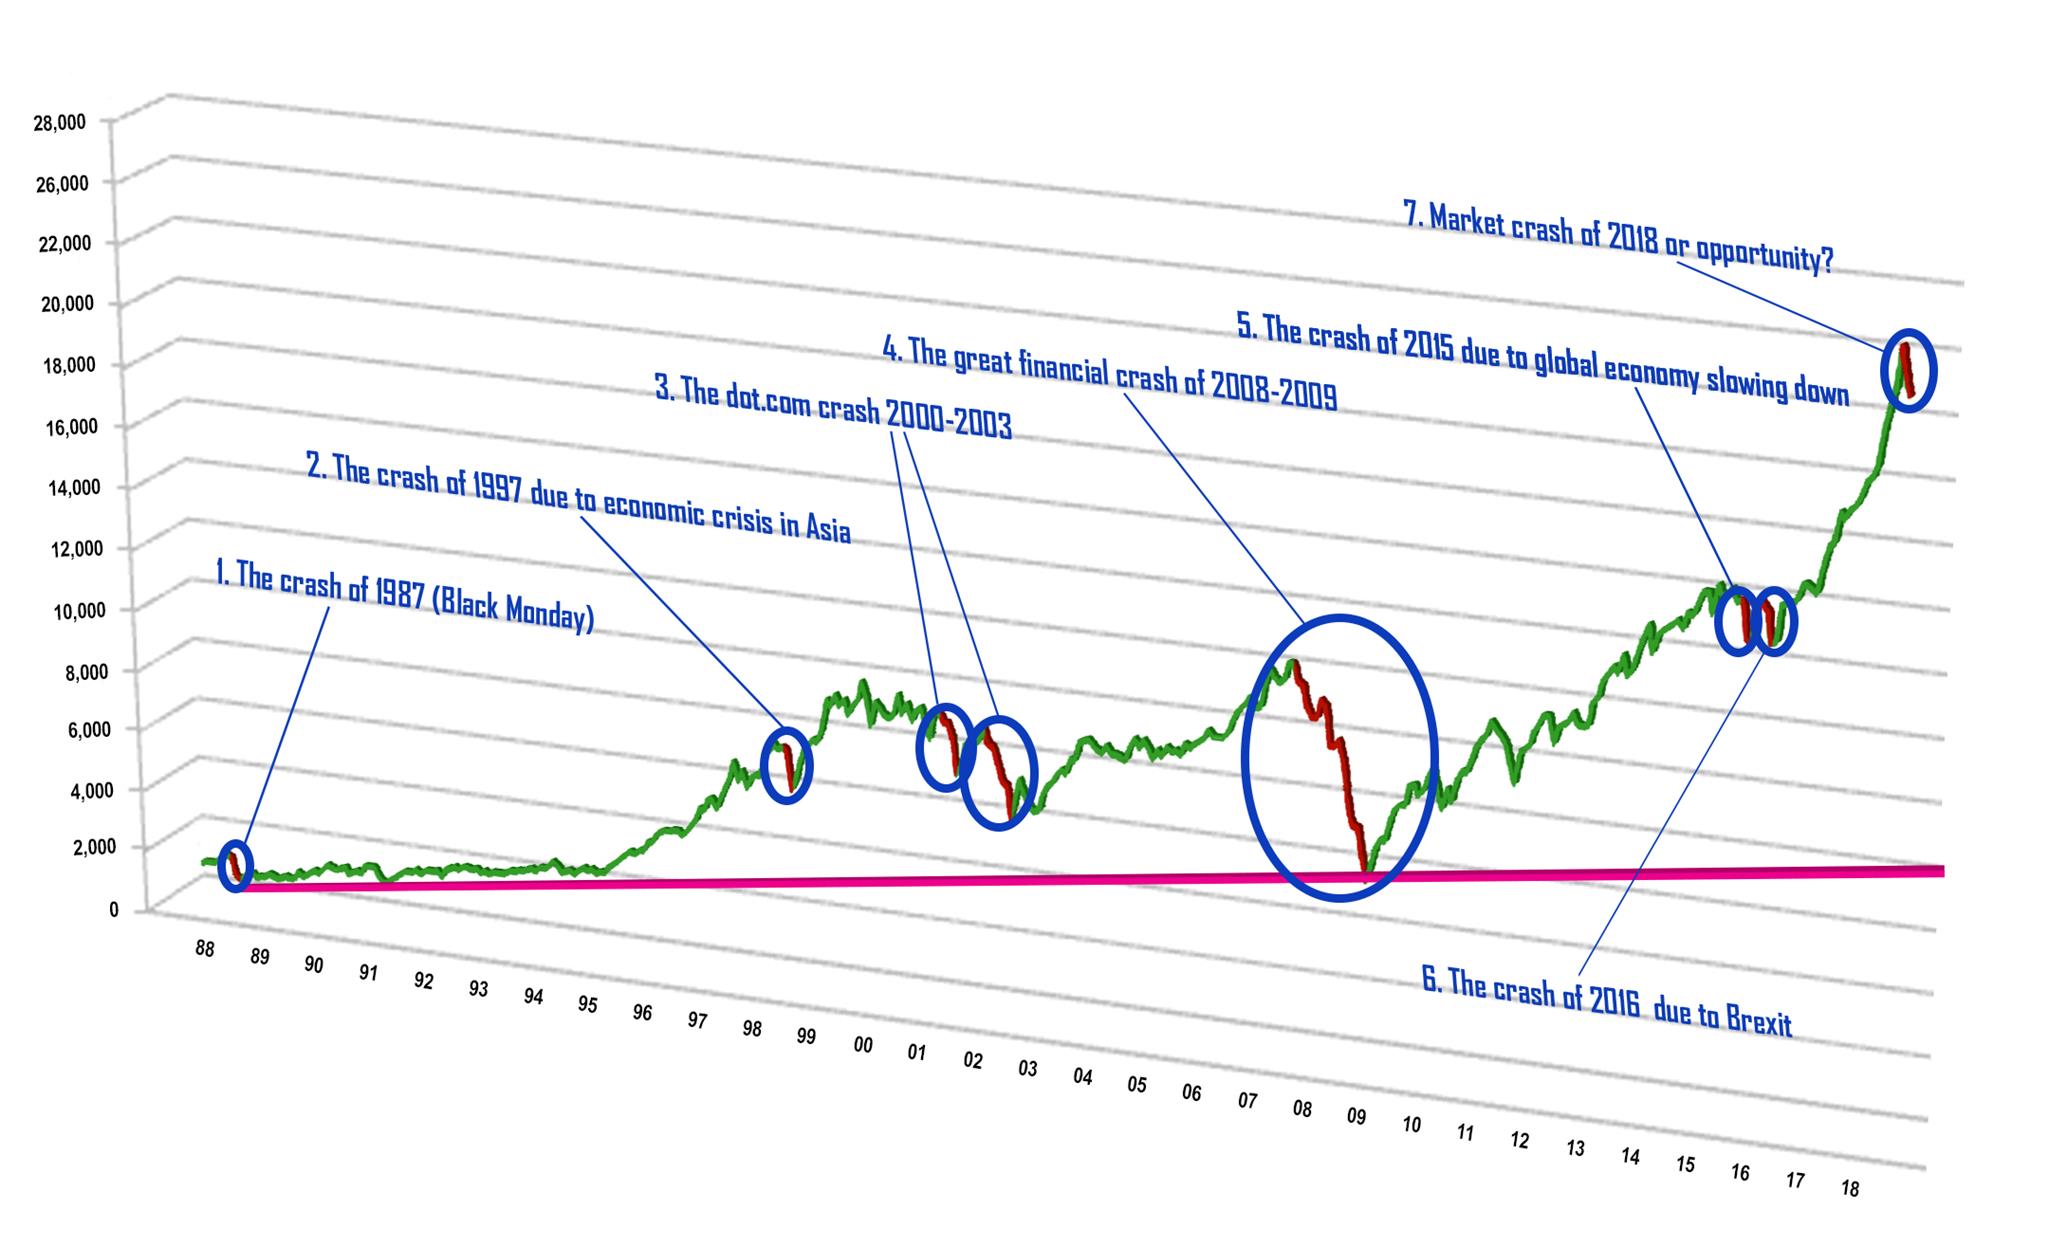
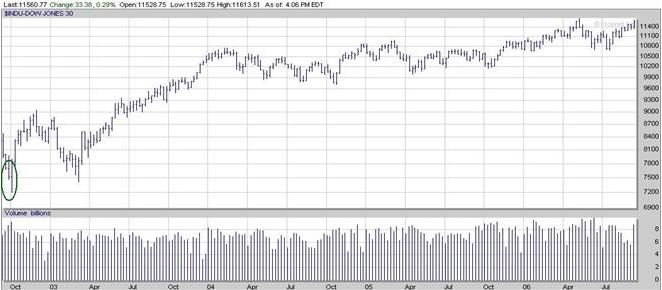
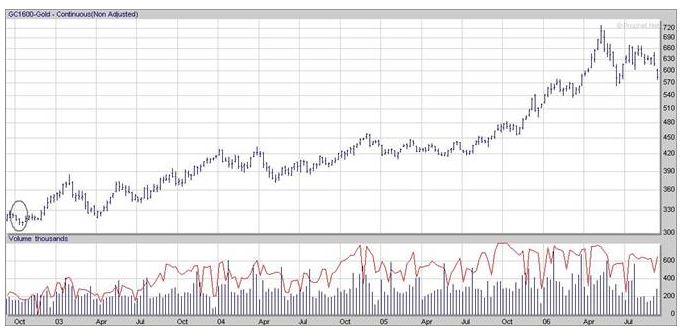
The obvious answer would be to save the opportunity for themselves. Think about it, if everyone understood this secret, and then they would not be able to make a killing, would they? For example, if you had just used every crash to buy top quality stocks for the past 20 years, you would probably be extremely rich by now. That’s the secret weapon that investors such as Buffett, Soros,  Mark Mobius, Sir Templeton, Icahn, etc. use to become super rich.

If you applied the same technique, you could also make a fortune. It’s called buy low and selling high, or a better term would be trend investing and that in a nutshell is how the smart money makes a fortune and they don’t want you to learn this secret.


The secret to making a fortune in the markets

The secret is very simple; it comes down to identifying the trend plain and simple. Once you know the trend, you can determine whether you should buy the dip or sell the rally.  This is what is behind the concept of buying low and selling high. The big players in Wall Street are privy to information that’s not available to the small investor. Hence the term “insiders”; the trend indicator levels the playing field and gives the small guy the same window of opportunity to act on.

making a fortune in the stock markets

Our Ace Card: The Trend Indicator makes second-guessing a thing of the past

The Trend Indicator combines the finest elements of Mass Psychology with the very best of Technical analysis. The chart below highlights the trend system in action. As you will spot instantly, we are not interested in determining the exact top or bottom, which is a task best reserved for those who seem to thrive on pain. We focus on spotting the trend and on identifying hidden opportunities, hence the name the “trend indicator”. The trend indicator informs you if it’s time to buy the dip or sell the rally.

Trend Indicator Chart

The trend indicator provides us with the same advantage the big market players have.  Instead of joining the stampede we will look for strong stocks to buy during the so-called “market crash phase” provided the trend is up.  If the trend is down (bearish), then we use rallies to short the market, conservative traders are advised to stay in cash.

You will never again have to worry about whether or not you should buy on the dip or sell into a rally.  The trend indicator will take care of that; all you have to do is determine what stocks you want to buy. In fact, we will take care of that too, so if you don’t want to compile a list of stocks to buy you don’t have to. Just sit and wait for our instructions.   To lower the risk even further, we focus on strong stocks that are trading in the extremely oversold ranges.

By keeping it simple, the trend indicator eliminates the “stress factor”. Everyone is busy today and time is of the essence, most individuals don’t have the time to pour of hundreds of charts or spend a countless number of hours on research. We utilise the KISS principle “keep it simple stupid.”

Ready to sign up? or Continue reading?


Many would charge thousands for such a system

But if we did that, it would be out of reach of the very people we are trying to help.  Our goal is to give the average Joe the same advantage many of the top-rated firms on Wall Street have.

Not only have made the system affordable but today we are throwing in an array of bonuses which will result in a savings of 72% for the life of the subscription. In other words, you will lock in this rate forever or until you decide to cancel.

But that’s not all look at the great list of bonuses we are offering

  1. Test Drive the service for 30 days for only $19.99 with no obligation. That’s 66 cents a day and much less than you would pay for a coffee at McDonald’s.
  2. Receive the ETF Trend Trader service for free, priced at $25 a month
  3. Free Trading Manual valued at $89.99
  4. The security centre that provides you with access to dozens of free utilities to protect you from the online threats we face today; value priceless.
  5. For the first ten subscribers, we are offering this exclusive report “The best ten stocks to own over the next ten ”


We have been around for 14 years which proves we are not some fly by night operation.  And remember there is no obligation for you to stay if you are not satisfied. The cancellation process is easy and fully automated you are in charge all the time as we use PayPal.

Lastly, unlike most financial newsletter services we respond to every subscriber email.


Value investing is dead?

Value investing

Value Investing is dead Update Dec 2019

Value investing appears to be dead?
Many subscribers have asked us why we don’t focus or pay more attention to fundamentals. One of the main pieces of data EPS can and is being easily manipulated via share buybacks, so that puts the whole concept of value investing or investing based on fundamentals into the toilet. Secondly, the data is provided in a standardised format, which means that almost every investor that uses it will more or less arrive at the same conclusion.
Move to mass psychology; very few have even heard of this topic, and there is no standardised book or formula to follow. There are very few books that even cover the topic adequately, and almost none of these books apply the topic of MP accurately when it comes to investing. As when choosing a cure for erectile dysfunction. Technical analysis is also interesting in that regard, for its based on an individual’s interpretation of a given pattern. You have to see the pattern and no two traders will see the exact pattern. Furthermore, we take an out of the box approach when it comes to technical analysis, and for the most part, we customize all our indicators. In a nutshell, that is why we don’t pay too much attention to fundamentals, and this is not a new approach; we have maintained this stance for over 17 years.

Whenever experts state that something is dead, hated or disliked, one has to start viewing that sector in a more favourable light. Value stocks are likely to start trending upwards shortly. We suspect one more wave of pain might be necessary to drive the last holdouts out of this sector.  CALM is an example of a value stock.  When the masses state something is dead, the opposite is usually true. Buy when the masses are panicking and run when they are Euphoric.

Market Sentiment


The small surge in bullishness appears to be short-lived, what remains constant is the number of individuals in the Neutral camp.  Until the individuals in the bullish camp surge past 70% for several weeks in a row, the markets are unlikely to put in a long-term top.  Corrections ranging from mild to strong is all most investors will have to worry about. Most of the pullbacks will be in the mild to medium ranges with the occasional pullback falling into the “strong” category.  At this point, the odds that the SPX will trade to and past 3000 are now close to 70%.

Despite being extremely overbought, the trend for the major indices of the world (Germany, US, Australia, Britain, etc.) is up.  The Australian markets are still extremely overbought both on the weekly and monthly charts, so at the least investors should wait till our indicators on the weekly charts pullback to the oversold ranges.

This market is in sore need of one strong pullback, but this market is irrational one cannot expect the market to pullback just because it’s trading in the extremely overbought ranges.  Therefore our gameplan is to continue opening long positions in stocks that are extremely oversold on the monthly charts. This plan will remain in force until 1-2 of the major indices like the Dow, SPX or Nasdaq experience a bearish signal on the monthly charts.
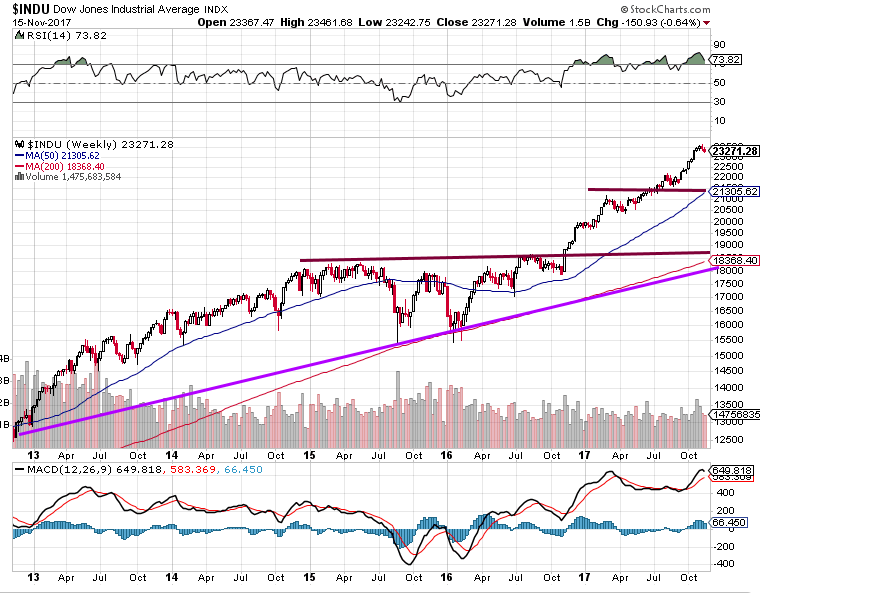


Though the Dow and the SPX are trading in the overbought ranges, on the weekly charts the Dow, as shown above, is gearing up to trend higher. The MACD’s have experienced a bullish crossover right at the halfway point (minimal oversold zone).  We would not be surprised if the Dow traded to the 23650-23800 ranges in the near future.

Risk takers can use pullbacks ranging from 350-450  points to open long positions. The Dow does not need to pull back 350-450 points in one day. For example, it is currently trading slightly above 23400. Risk takers could open long positions from 22950 to the 23050 ranges.


Published courtesy of the Tactical Investor

Stock Market Crashes Myths

Stock market crash myths

Stock market Crash Myths focus on the fear factor and obscure the Opportunity factor

Our overall philosophy is to let the trend do the talking, especially in this day and age when market manipulation is the order of the day.  The markets are not free; corrections end at arbitrary points. In other words, the top players decide when the markets will correct and how far they will drop and or rise.  This is why we focus on the trend and not absolute price targets as almost all free market forces have been removed. It took us an inordinate amount of time and money to come out with the trend indicator. Imagine how much easier it is to trade if you know the trend if you know that a pullback is a buying opportunity in advance of the fact.

Don’t fixate on trying to predict the exact top or bottom

However, some individuals are still fixated on the idea of exact points, as opposed to the idea of viewing strong pullbacks as buying opportunities.  This kind of mentality is what led these individuals to miss out on this 7-year bull market, and they look back sorrowfully wishing they had jumped in. What they forget is that they were doing the exact same thing today as they were doing yesterday. This is the reason this market is going to soar far higher than anyone expects.  There are many investors out there that fall into this category, and the sad part is that they do not even realize by adopting this mindset that they will end up buying right at the top out of pure frustration at having missed the entire ride up by waiting for that so-called perfect entry point.

If logic governed the markets, then all those with PhD’s would be rich

If reason governed markets, then all those with PhD’s and higher education would be the ones raking in the highest gains; instead, these chaps are the ones that consistently lose.   You need to change your mindset now and throw this fear out of the window. Stop waiting for others to give you the push you need to give yourself. You cannot expect someone to dig you out of the hole you dug yourself into. Your biggest problem is fear; the second one is that you are angry and upset that you missed the ride up so far.  The longer you hold onto the old mindset, the more you will lose.

You have two options now

  • Change today or risk losing even more in gains. There is no such thing as a perfect entry point. While we do issue targets, we understand that especially when it comes to major indices such as the Dow and SPX, that target might or might not be hit. As we have stated for the umpteenth time, there are almost no free market forces at play now; the top players decide at what arbitrary levels the correction ends. This is another reason the markets are experiencing such extreme moves as predicted in advance by our V-indicator. So the solution is simple. Make up a list of stocks, ETF’s, I-shares, etc. that you wanted to buy and wait for pullbacks to jump in. If you do not want to do any work, then you can open positions in the stocks plays we issue.  Remember there is no such thing as a perfect entry point. If that ever comes to pass, it should be assigned to pure luck, but if you wait for only for that moment, you will miss the whole ride up.
  • The second option is to continue to do what you are doing now and hope that the outcome changes with the time. However, remember that the definition of insanity is doing the same thing over and over again, and hoping for a new outcome.


The trends in all three indices, for now, is Up

So the course of action is simple; strong pullbacks are buying opportunities; the stronger the pullback, the better the opportunity.  It is a bit too early for us to look at what the markets will do next year, but we can already see signs that 2016 should be another strong year for the markets. Once again, those waiting for the ideal entry points will be left behind.  They will look back at today’s entry points and wish they had bought, just as they looked at the entry points they refused to jump in at 2014 and now wished they had jumped in. What separates today from yesterday? Nothing, they are held back by fear and then suddenly try to do something because they are angry that they missed this ride.

Masses will Jump in at or very close to the Top

Mark our words, these individuals will jump into the markets almost at or close to the top; at that point, Euphoria will be setting in, and it will be time for us to leave. What we find strange and amusing is how they will persuade themselves to jump into the market one day in the future when it is extremely overvalued and hesitate to do anything now, when it is not. Do not join this crew, for even though they claim to want change, they do the same thing over and over again. If they would simply sit down and look at what drove them before, they will see that the same set of silly emotions is driving them today. Hence, they are destined to lose. You cannot win using a methodology that failed before. There is a name for this; it’s called insanity.

If you are part of this group and want to break free, then force yourself to go against your emotions. Do the opposite of what you think you should, especially if it has failed to produce any results in the past.  Going forward view every strong pullback as a buying opportunity; change will not come from standing still.


Published courtesy of the Tactical Investor

20 top Online financial resources on becoming a better trader


Online financial resources

We have listed a plethora of online trading resources below and yes they are all free.  These resources will provide both the seasoned and novice investors with information to help you in your in your quest in becoming a better trader/investor.

One should attempt to understand the basics of technical analysis and market sentiment tools, as both these tools could greatly improve your odds of success in the markets.   When it comes to trading its the calm and informed investor that always catches the worm as opposed to the bullet. Pay also to the psychology of the masses as it provides valuable data in terms of gauging whether a market is close to putting in a top or a bottom.

Technical analysis is an art and not a science, as many would have you believe. Thus, if you just memorise techniques written in books you will have understood only one aspect of Technical Analysis; you will learn the meaning of the tools based on someone else’s definition of what it is supposed to do and what it is not supposed to do.

No one person can tell you exactly how all the tools work, granted some individuals have invented specific tools and hence are authorities on that specific tool but they are not authorities on every Technical Analysis tool out there. Even the TA tools they have invented can be adjusted to suit your trading or investing requirements; the settings in all TA tools should be adjusted and tweaked till you find one that you can work well with.

The best method when it comes to Technical Analysis is to use a combo of TA tools 1-5, this way you are not relying on one indicator alone; as the saying goes practice makes perfect so keep at it. Over time, looking a the technical pattern of a stock will become second nature.

We hope you find the list of free trading resources we have compiled to be of use


SENTIMENT, MARKET TIMING AND OPTION TOOLS

Trim Tabs Flow of Funds

Put Call Ratio

NYSE Breadth

Bullish percentage Index 

Introduction to Options 

Free Option quotes 

ECONOMIC NEWS

Federal Reserve Board News

Economic News & Charts

Dept of Labour News

FINANCIAL NEWS

STOCK SCREENERS

Stock Consultant

Yahoo Stock Screener

EDUCATIONAL MATERIALS

Incredible Charts

Chart Patterns

Investopedia

Sector Strength

Barcharts

EARNINGS

Yahoo Earnings Calendar

COMMODITIES AND STOCK CHARTS

Commodities & Currency Data

Currency & Metal Charts

Incredible Charts Software

Big Charts (Online Charting)

More Charts

INO: Stock and Futures Charts

FREE CHARTING SOFTWARE

Free Charting Program

Stock Analyzer

PORTFOLIO TRACKERS AND BULLETIN BOARDS

Free Portfolio Tracker from Google 

Zack’s Portfolio Tracker

Why it’s dangerous to rely on mechanical trading systems?

Mechanical trading systems

What Is Mechanical Investing?

Mechanical trading systems or just mechanical investing is any one of a number of ways of buying and selling stocks according to pre-set criteria or triggers. The primary purpose of this approach is to remove as much human emotional behavior as possible. Emotions will often negatively impact or cloud rational investment decisions. A systematic investment plan can be partly based on factors that an active investment manager applies, but it is mostly intended to be implemented on autopilot.

How Mechanical Investing Works
Mechanical investing can take many forms. It can be as simple as a set dollar or paycheck percentage amount into a 401(k) account, for instance, or a commitment to buy a stock when its valuation falls to a certain price-to-earnings ratio and sell it when the valuation hits a higher predetermined level.

Valuation markers are common in mechanical investing, but technical analysis may also inform an automated approach to investing. Moving averages, whether simple or exponential, 50-day, 200-day or another time period, can serve as triggers to buy or sell stocks. The Relative Strength Index (RSI) or the Moving Average Convergence Divergence (MACD) are two other popular signals upon which a mechanical investor sets trading orders.

Whatever criteria is used by the investor, the idea is to remove subjective feelings and second-guessing from trading of stocks (or other securities) and stick with a disciplined approach. Mechanical investing can be considered akin to passive investing, whereby money is normally put to work consistently over time, but at least some sort of thought-out criteria is applied. Full Story

Technical indicators or Fundamental Analysis 

Individuals, especially novice plays are always lead astray when it comes to Technical indicators and trading.  One school pushes technical indicators, while the other school pushes for fundamental analysis. In an abstract way, fundamental analysis is nothing but a mechanical system in disguise. The data is provided in a standard manner, and so anyone can decipher it with almost no effort. Mechanical trading systems put forth a set of rules; all one has to do is follow these rules.  In essence, everyone following this rules could arrive at the same conclusion.

The paradox theory states that one will get exactly the opposite of what one chases.  The same holds true in the arena of technical indicators and trading. Be realistic and do not assume that these indicators alone will always keep you out of harm’s way. We all know that at any given time the masses must lose to be able to feed the big players. That’s why the 90/10 ratio has almost seen no variation over the decades.  90% represents the percentage of losers and 10% the proportion of winners. Hence, it is important to understand the basic principles of basic portfolio management before committing money to the financial markets.


Technical Indicators can work but the system should not be fully mechanical in nature

We could go on into great detail about why mechanical trading systems almost always fail, but the theme would be the same.  So in the interest of keeping you awake, we will keep it short and sweet. Let’s just pause for a second here and investigate the name “Mechanical.” One of the definitions by Merriam’s Webster online dictionary is “done as if by machine: seemingly uninfluenced by the mind or emotions.

Notice the key words here uninfluenced by the mind or emotions. First of all the market is nothing but a composition of a million minds.  Using a system that’s based on the rules set forth by one man’s mind and worse still devoid of any mental influence is a recipe for disaster. Secondly, the marketplace is nothing but a sweat pool of emotions; lust, greed, power, hate, fear, etc. swirling through the markets like a hurricane.   Technical Indicators should be part of your trading strategy but it should not base your entire strategy on technical analysis.


Trading Indicators and even best Mechanical trading systems do not work forever

It’s virtually impossible for a mechanical system to last forever since by designing anything mechanical must and will break down at some given point in time. It’s rather amusing the terms we chose to represent the things we use or to define what side of the markets we are on. It’s almost as if we have nothing but a secretly programmed desire to lose syndrome ingrained deep with our psyches. Bullish and bearish, we choose two of the most stupid, dumbest, irrational and easily angered animals to represent whether we think the market will go up and down.

Then if we happen to be individuals that favour just one sector we come up with the term bugs as Internet bugs or gold bugs. Why such a disgusting animal to represent one’s position and views. As we all know most humans react in an adverse way to bugs, the first thought that springs to mind are to crush them.


Even examining the language we use in the marketplaces illustrates further psychological issues; scalp, plunge, up thrust, perfect bottom, down thrust, flip, climactic sell-off, etc.

The worst part of all this is that we pass nothing new to the next generation. We just reinforce these Neanderthal views, in fact branding them into the next generations memory more aptly describes the process. Is it any wonder then that we keep repeating the previous generation’s mistakes? Moreover  we do so in a much more grandiose manner. Just look at the speculative phase we have entered now (credit bubble, real estate bubble and so on) it makes all the mistakes our ancestors made pale in comparison.

We leverage ourselves to our necks with debt to buy goods we don’t need and use the money we don’t have to pay for them.  The real estate bubble is one classic example of madness and history repeating itself on a gigantic scale. Individuals take home equity loans against the rising values of their homes and use this to finance their extravagant lifestyles. Is there anything more insane, taking credit to buy something more on credit?

Getting back to the topic at hand; no one is taught to look at the markets as a game and study the mass mind and behaviour of individuals. After that one can go about trying to master a  few Technical Analysis tools that are open to subjective interpretation. By personal interpretation, we are referring to the statement that “beauty lies in the eye of the beholder.” Each should see something different when using such an indicator. This TA tool must never be allowed to become standardised. If it is, the end is near. The ones that learn to correctly master this tool will come out ahead. However since the method is not available in a standardised format, this system could work almost indefinitely.

In the end, mechanical trading systems are reflective of our lifestyle and the way we are as a group of individuals; the 9-5 rat race and the zombie-like a nation where everyone thinks and acts like one. A mechanical system is also reflective of the fact that most of us do not want to think, we want everything handed down to us and when we get whacked on the head we cry like babies. It is, for this reason, we never seem to learn from history but only look for ways to perpetuate the same mistakes on a colourful style. The only way to break from this way of thinking is to attempt to start thinking and using your mind.

There is nothing wrong with making a mistake because you might learn something as a result of one; perpetuating someone else’s mistakes provides no clues for improvement but only rules for self-destruction.

Customization is  the key when it comes to  using Technical Indicators 

At the very least some customization should be attempted so that the system is adapted to one’s needs. It amazes me that the easiest and most efficient system in the world is not studied or followed more widely. The system I am referring to is trend analysis; all you do is spot a new trend and stay on board till the trend ends. Trend analysis involves the drawing of simple lines; it takes a little practice but is worth its weight in platinum.

When using Technical Indicators, it is best to use ones that are not widely followed or if you are using Technical indicators that are widely followed then you should consider adjusting the parameters.

So let’s look at what type of system can and will work in the markets. First of all, one has to understand the difference between contrarian investing and investing based on Mass psychology. Contrarian investing is a very simple system as it involves taking a position against the masses. Mass psychology measures the frenzy periods or times of extreme hate or disgust towards a particular sector or sectors, and then a position is taken during these desperate times.

Furthermore, Mass Psychology measures the level of euphoria in the camps of those that believe in the investment.it will measure how many of the so-called contrarians are now extremely bullish and euphoric in a given sector. In most cases when a contrarian takes a position in a particular industry, he is doing so as a counter move to what the masses are doing. However, the majority of the contrariansare still nervous and keep checking their positions rather frequently to make sure that at the very least the bottom is in.

Once the sector starts to take off and produce returns they lose this nervousness and become very bullish; in other words, they have now entered the euphoric phase. This is where mass psychology kicks in. At this point it will be time for the smart investor to bail out, you may not be selling at the top, but you will be pretty close to it.

So understanding mass psychology is an important and integral part of a trading system. Secondly, one should master several technical Indicators in order to improve your technical analysis of the Financial markets. Thirdly you need to understand be patient and disciplined. You have to understand that sometimes you might have to wait for months on end before you can take a position. However, you could be rewarded in weeks for your patience.

Published courtesy of the Tactical Investor

Contrarian investing made easy

Contrarian investing made easy

The psychology of contrarian investors; Gauge the sentiment before acting 

The first thing is to make sure you understand the difference between contrarian investing and Fashion Contrarian investing.  These contrarian investment guidelines by no means encompass everything one needs to know about trading, but it can seriously help you become a better trader/investor.

Rule 1

All popular magazines, news articles and TV stations should be used only for obtaining information that you don’t plan on using; you use this information to find out what the masses are doing.   For example,  if they tell you its time to buy gold, its time to get ready to sell if they tell you the market looks like its going to crash, we are probably close to a bottom etc

 Rule 2

Spend time learning Technical Analysis; this is very important. We have just updated the investor tools section on our web page. There are many educational resources there now, so use them it cost you nothing and took us time to put them up. Free Trading Resources

 Rule 3

Have a plan. only fools buy or sell stocks without a plan. The plan should include profit targets on each and every trade, plus and this very important, an exit plan, in case the trade does not work out.

Rule No 4 

Do not deal with options it should be part of your investment plan but not your only plan. You are far better of playing futures if you are going to waste all your money on options only, futures are much cleaner, less slippage, less spread and you can get a feel for it because you can study the pattern of one market. I am not saying that everyone should get up and play futures, but if you are going to be a fool and play only options, then the wiser thing to do would be to learn futures and attempt to get in tune with one of the markets ie Dow futures. In addition, remember the saying “A fool and his money are soon parted”; having said that options are absolutely fabulous instruments to lock in spectacular profits.

Contrarian Investing No 5

With proper money management, one could lose his entire options portfolio and still walk away with a profit.

We will use a 100K portfolio for this example

10% is 10K

Okay, you lose the entire 10K by playing options idiotically.

Now you play nice and safely with the other 90K and you make 30% for the year. Don’t say it’s not possible; all of you who have long-term positions in Gold is up more than 30% this year alone. Just catch the major trend and follow it. So you make 27K so you know have a total of 117K, but let’s say you make only 20% that brings the total to 108K, you could even make 15% and still walk away with a profit.

The key here is that you live to fight again and then you can take some of these profits and play options once more

The most important factor to remember is that all stock market crashes or strong corrections should be viewed through a bullish lens from a long-term perspective.

The stock market is not static its dynamic

In addition to the above essential rules of contrarian investing, investors would do well to read the following new notes.  Investing is not a static field; it’s a dynamic field, and you have to in it to win it. In other words, just sitting on the sidelines hoping to gather all the information via theoretical models will only work well in an intellectual environment. Real life and actual market action is an entirely different beast.  Start small, learn from your mistakes, keep notes and when you start to trade successfully slowly increase the dollar amount of your investments.

An accurate measure is that you buy because the price is at mouth-watering levels, it’s in a strong sector, and you checked the charts. Your purchase passes the necessary technical analysis tests.

One key point to remember is that even though everything looks good, you should still be nervous or scared. You should be saying something like this, “Hey, am I the only one buying. I don’t want to go against the crowd. A true Contrarian always feels this fear, and you have to fight it, and say, “Now is the time to buy.”

Over Confidence is dangerous

When you are overly confident, it’s time to flee.  Even the best can be taken out. Keep your mental stops tight in this volatile market. Let me expand on the subject:

When you take a position and people look at you with disdain or shock, you know you are doing the right thing!. When they pat you on the back or the rear, it’s time to flee for the exits Gold and silver and commodities are still hated with a passion. Therefore, one has to understand that the massive hate for this sector makes it the best contrarian play ever. Get it? Buy low. Sell high.

Finally, we hope that these contrarian investment guidelines prove to be useful to you now and in the years to come.


Market crashes -The best time to buy stocks

Best time to buy stocks

While Experts Panic Tactical Investor states Stock Market Crashes and Bear Markets are Buying opportunities

We decided to apply the simple concept of pricing the Dow in Gold and Silver in the same way we did in an article titled Dow 1200 Illusion or? We will take the low of the Dow in the last four years and the low that gold put in the last four years. As the Dow is priced in Dollars, we will divide the price of gold into the Dow. For the record, we could choose other price points as they only serve to illustrate our point.

In Oct 2002 the Dow was trading at 7200 (4-year chart), and Gold was trading roughly around 300.

Dow

Gold

Gold chart

If we divide 7200 by 300 (the price of Gold), we get 24 ounces. Now it took 24 ounces of Gold to buy the Dow back in Oct 2002 (remember we taking the Dow’s lows into consideration and not it’s highs) so it should take at least 24 ounces or more to buy the Dow today. Let’s check that figure out.In May of this year, the Dow put in a new 52 week high and almost tested its old all-time high of roughly 11700. For argument’s sake, we will assume that the Dow traded to 11700 in May. At that time Gold put in a high of roughly 720.

11700 divide by 720 = 16.25

Back in 0ct 2002, it took 24 ounces to buy the Dow and at this time it was trading at a four-year low. This means that the Dow was trading higher back in Oct 2002 then it was today because today it takes 8 ounces less of Gold to buy the Dow when it’s trading at close to a new five years high. For the Dow just to break even to its Oct 2002 levels it would have to be at (24 X 720) 17280.

The Dow only made it to 11700 so far. That mean the Dow has corrected over 35% as it should be at 17280 instead it’s below 11700. Market technicians state that we are in a bear market if the market has corrected over 20%. Based on these figures we have corrected over 35%, yet the Dow has just put in a series of new illusory 52 week highs. Hence, in reality, the market could technically rally a lot more and still be in a bear market. The funny part is that the bears are right, but they just don’t know how to use this info, and the bulls are wrong, but they happen to use the info for the time being in the right manner.


You might also find this related article to be of interestShould you fear Stock Market Crashes

If we use Silver as the constant, the figure we get is even more outrageous, and it suggests that the markets have corrected even more than 35%.

Silver was trading around the 5.15 mark in Oct 2002.

Dow 7200 divided by 5.15 = 1398 ounces

May 06 Silver traded roughly to 15 dollars

1398 X 15= 20970; that’s the level the Dow should be just to equal the level it was trading in Oct 2002 when priced in silver.

This means that the Dow has already corrected a whopping 44.2%, and yet it has put in a series of new 52 week highs. These highs are all illusory in nature.

Since the Dow is priced in dollars lets, perform a final test on the Dow. The Dow hit an all-time high back in 2000 (look at the picture below). To simplify matters, let’s assume the value of this high was 11700 (actually it’s higher).

DOW chart 2006

Dollar chart 2006

Now let’s look at what the dollar was doing in the same period. At the time the Dow put in it’s all time high the dollar index was trading around 105; this is roughly 20 points (currently in the 85 ranges) lower than where it’s trading right now. On a % basis, it works out to 19.5%. To make things simple, we will round it off to 20. That means the in today’s dollars the Dow would have to trade 20% higher than the high it put back in 2000 just to break even. At this point, the chances of the Dow trading to the 14040 price point level are slim to none. If we were wildly optimistic we would probably issue a target of 12600 at the most; for the record, we are not wildly optimistic at this point.

Conclusion; forget the noise and focus on the trend

This is yet another completely out of the box way of examining the markets and what they are doing. This viewpoint provides yet another valid reason to support our bullish outlook on the intermediate time frames. We are still bearish when taking the long-term view. However, a lot can happen between the short, intermediate and long time frames. If you are not correctly positioned, you could end up bankrupt while being right.

One could technically state that the market is only experiencing a long dead cat’s bounce or that we are in a long-term bear that is truly invisible for the time being. In the end, one must understand that when one is dealing with the markets that nothing remains the same forever; those who examine the markets with closed eyes and a closed mindset will find that their wallets enter into the empty rather rapidly.  This little exercise also very clearly illustrates the evils of inflation.

Since we can’t know what knowledge will be most needed in the future, it is senseless to try to teach it in advance. Instead, we should try to turn out people who love learning so much and learn so well that they will be able to learn whatever needs to be learned. John Holt 1908-1967, Australian Politician, Prime Minister

Final note

Please remember we are just offering another possible way of looking at the Dow. Do not only jump on the super bullish bandwagon and assume that the Dow is going to keep soaring upwards forever.

Charts were provided courtesy of prophet finance

Additional Suggestions

If you seek freedom, the 1st task is to attain financial freedom so that you can break free the clutches of the top players who seek to enslave you. They want you to run in a circle like a hamster that runs on a spinning wheel; the hamster thinks the faster it runs the further it will go, but sadly it is going nowhere.

We teach how to use Mass psychology to your advantage, how to view disasters as opportunities and how not to let the media manipulate you and direct you towards actions that could be detrimental to your overall well-being.  Visit the investing for dummies section of our website; it contains a plethora of free resources and covers the most important aspects of mass psychology.

Secondly, subscribe to our free newsletter to keep abreast of the latest developments. Change begins now and not tomorrow, for tomorrow never comes. Understand that nothing will change if you don’t alter your perspective and change your mindset. If you cling to the mass mindset, the top players will continue to fleece you; the choice is yours; resist and break free or sit down and do nothing.


Everything you wanted to know about psychology and investing

Crowd psychology and investing

Over the years we have found out that the most significant dynamic force that drives the markets is emotions. Psychology is the study of emotions and mass psychology is the study of the masses. This is why we put together the psychology for dummies section. Our, focus is on teaching individuals, how to use Crowd Psychology to their advantage.

Once you understand how to use this data you can further refine your skills by mastering the art of Technical Mass psychology and investing Analysis.  We have dedicated a huge amount of time to put out the Psychology for Dummies section, and we hope it helps shed some light on this topic.  Understanding how the markets operate is not something that can be mastered in 1-3 day.

Identifying the problem is over 80% of the solution. Once you have identified the problem, you can focus on the solution. In this instance, the psychology for dummies section has done most of the work for you.  Finally, before you start trading with real money, our advice is to paper trade for a while.  You will find out that there are things you can only learn from experience and not by simply reading a text.  After paper, trading, you should start playing with small amounts of real money and then slowly increase the amount of money you commit to each trade.

Investing for dummies; Mass Psychology resources 

Investing for dummies: Contrarian Investing Ideas


Investing for dummies: Technical analysis and fundamental investment rules


Investing for dummies: Dividend and Growth investing ideas 

Random Thoughts on Investing for dummies

If you like a guiding hand while you slowly master this process, consider signing up for the market update.   We focus on  Crowd Psychology and utilise Key proprietary tools that we have spent decades developing.  The most efficient of which is the Trend Indicator.   What makes the market update service different? Our approach, we do not fixate only on issuing trades but also on helping the individual understand the markets and become a better trader.

Courtesy of Tactical Investor


Articles by authors we think you will find interesting

Contrarian investing made easy

20 top Online financial resources on becoming a better trader

Everything you wanted to know about psychology and investing

Bitcoin is set to crash

USA Debt To GDP Means Nothing To Bonds and Stocks

Market Timing

Why aren’t millennials investing?